


Hi everyone!
Welcome to the 21st issue of the Viz of the Week newsletter, where I'll be featuring a new visual each week and sharing the code behind it.
I want to give a special welcome to the 6 new subscribers that joined this week. 🤍
If you haven't subscribed and wish to receive these posts straight to your inbox, subscribe to join the community and receive free updates!
For this week's visual, I took inspiration from Shreyas' probability distribution plots and added a funky Halloween theme to meet the occasion.
I would normally post this as an end-of-season performance evaluator but Erling Haaland is already doing Haaland things a third of the season in
— Shreyas (@khatri_shreyas) October 27, 2022
High volume shooter, high efficiency shooter, and incredible finisher simultaneously pic.twitter.com/7NdI8nBXwJ
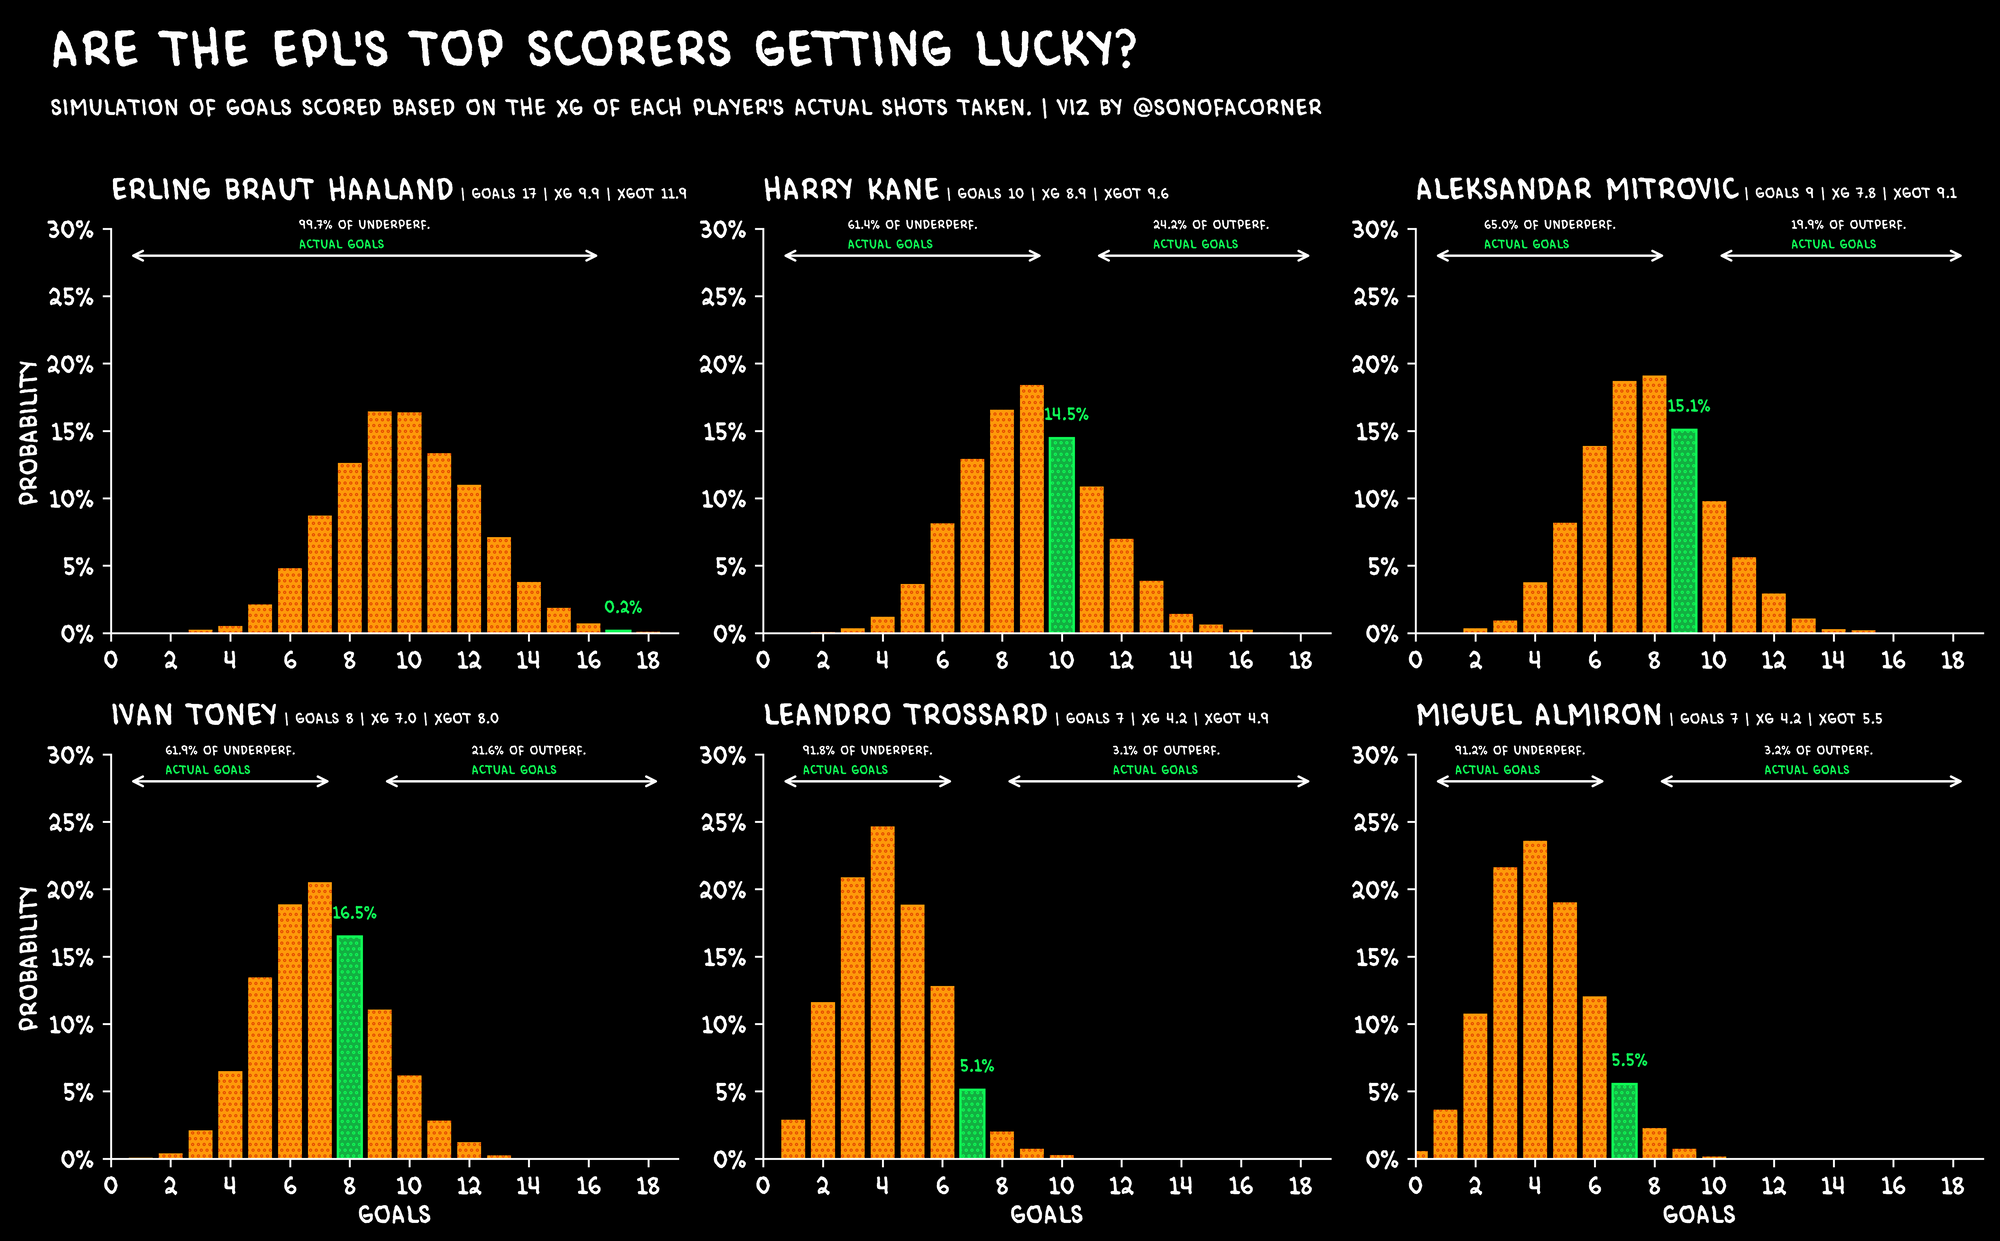
Look closely at Haaland's, Trossard's, and Almiron's numbers, they're just insane.
According to Opta's model, the three of them had a 90% chance of scoring fewer goals than what they actually did – in Haaland's case that figure is a staggering 99%.
From Around the Grounds
Here are some of the cool things I saw from the community on Twitter this past week 😀
Fuad's #IronViz
This is an amazing and elegant visual, it even made me want to learn Tableau!
Finished my #Ironviz - The Race for the Golden Boot. I take a look at Erling Haaland's incredible start this season in the English Premier League.
— Fuad (@Fuad9510) October 30, 2022
Inspired by the work of some favorites @_CJMayes @jonollington @sonofacorner @petermckeever
🔗https://t.co/yQ4pospBKz pic.twitter.com/8E56uogS29
JKD's EPL Defensive Contributions
✨📊 A quick look at the Premier League's top defensive contributors so far this season!
— JK (@_JKDS_) October 24, 2022
Players are assessed against ability to win balls directly from opposition through tackles, interceptions, etc (left-hand axis), and ability to recover loose balls (right-hand axis) (1/2) pic.twitter.com/swOTIVxYu9
The code
I hope you enjoyed today's post. As always, you're welcome to take a look at my code and reproduce the visual.
If you get consistent value out of the site, consider becoming a paying member to support the improvement and content available on the website. I would really appreciate it!
All you need to do is check out my GitHub to get access to the notebook and the data behind it.